導入の経緯
- 燻製を作りたくなりました から Raspberry Pi 4 を導入する流れの続き
- 本稿では、Raspberry Piで熱電対で測定してグラフで表示しCSVに保存までできたので、熱電対を2つ使用したところを記載
熱電対2つ使用
SPI通信について
参考リンク
- 参考リンクによると、使用している通信の種類は、SPIを使用している、とのこと
- SPI通信は、複数のデバイスと接続できるとのこと
- MAX31855の所の、Vin、GND、CLK、DOは、共通にでき、CSを個別に持てば通信できそう、とのことで、MAX31855を追加購入して、見よう見まねで同時測定ができるか試してみました
購入品(熱電対関係)
リンク
リンク
スクリプト修正
- スクリプト変更点
※前回のスクリプトが実行できている前提。
- 熱電対との通信部分は、基のコードを参考に、ほぼ丸々コピー
- 冒頭の
digitalio.DigitalInOutと、adafruit_max31855.MAX31855を分離させ、追加の熱電対は、board.D6とした
spi = board.SPI() cs = digitalio.DigitalInOut(board.D5) cs_2 = digitalio.DigitalInOut(board.D6) max31855 = adafruit_max31855.MAX31855(spi, cs) max31855_2 = adafruit_max31855.MAX31855(spi, cs_2) - スクリプトの修正
ファイル名を、
testenvフォルダ内の、max31855_test_gc2.pyとした- 熱電対について
- SPIチップセレクト?は、
D5とD6を使用する
- SPIチップセレクト?は、
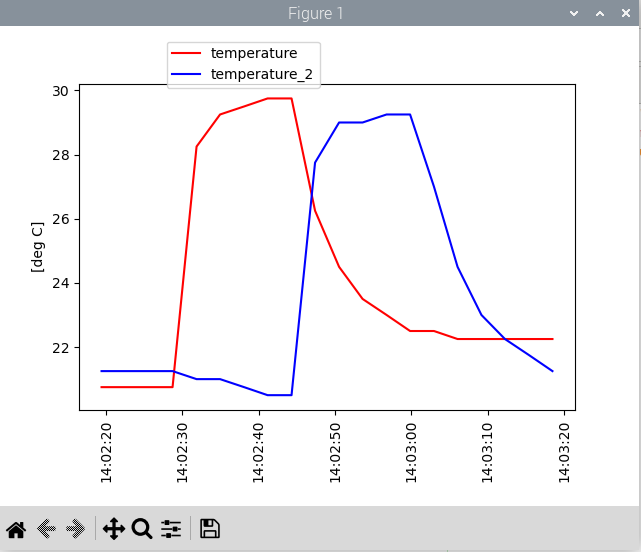
- グラフについて
- 単純に、測定結果をリアルタイムに表示します
inv_t:約3秒間隔で取得/プロットしますmax_plot_number:最大プロット数は、3時間分としました- 2つの熱電対を、同じグラフに表示させます
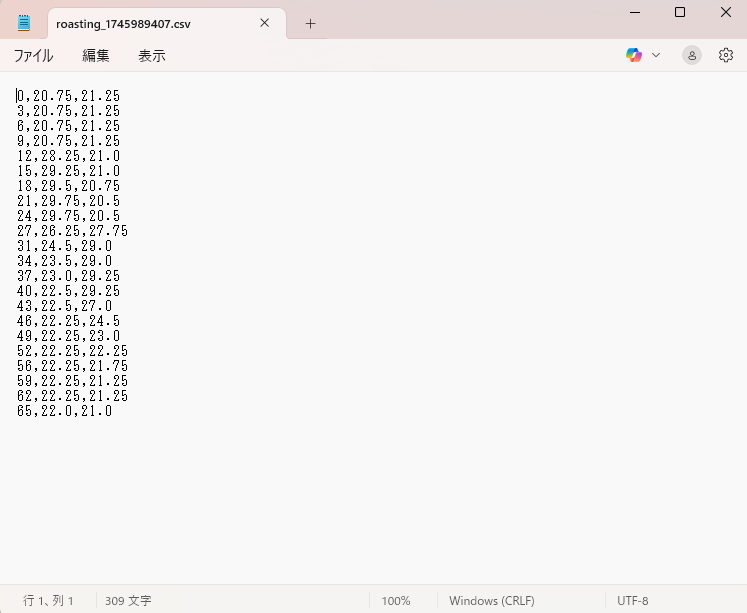
- CSVについて
- 作成した時間をファイル名としています
- 測定6時間ごとにファイルに書き出します
- Ctrl+Cで終了した場合、その時点まででファイルに書き出します
- Ctrl+Cで終了します
他、グラフの複数プロットは、以下を参考に修正
# SPDX-FileCopyrightText: 2021 ladyada for Adafruit Industries # SPDX-License-Identifier: MIT import time import board import digitalio import adafruit_max31855 import datetime import matplotlib.pyplot as plt import matplotlib.dates as mdates import csv spi = board.SPI() cs = digitalio.DigitalInOut(board.D5) cs_2 = digitalio.DigitalInOut(board.D6) max31855 = adafruit_max31855.MAX31855(spi, cs) max31855_2 = adafruit_max31855.MAX31855(spi, cs_2) #graph x = []#date time y = []#tempC y_2 = []#tempC_2 ax = plt.subplot()#plot inv_t = 3#3sec interval max_plot_number = int(60*60*3/inv_t)#max plot 3hr #csv start = time.time() data = [] num_csv = int(60*60*6/inv_t)#6hr unit def exp_csv(): filename = f"roasting_{int(time.time())}.csv" with open(filename, mode="w", encoding="utf-8") as file: writer = csv.writer(file) writer.writerows(data) try: while True: tempC = max31855.temperature tempC_2 = max31855_2.temperature now = time.time() data.append([ int (now - start), tempC, tempC_2]) x.append(datetime.datetime.now())# x add now date time y.append(tempC)#add temp y_2.append(tempC_2)#add temp ax.set_ylabel("[deg C]")# label plt.setp(ax.get_xticklabels(),rotation=90)#label rot 90deg plt.subplots_adjust(bottom=0.2)#shift plot area ax.xaxis.set_major_formatter(mdates.DateFormatter('%H:%M:%S'))#x label format ax.plot(x[-max_plot_number:],y[-max_plot_number:],'-',color = "red",label= "temperature")#add ax.plot(x[-max_plot_number:],y_2[-max_plot_number:],'-',color = "blue",label= "temperature_2")#add ax.legend(bbox_to_anchor = (0.5,1.15))#hanrei print("Temperature: {} C {} C".format(tempC, tempC_2)) if len(data) > num_csv : exp_csv() data.clear() plt.pause(inv_t)#wait 3sec ax.clear()#init except KeyboardInterrupt:# key -> e exp_csv() - 熱電対について
実行
LXTerminal で以下を実行する
- 仮想環境構築
cd testenv python -m venv .env --system-site-packages source .env/bin/activate - 実行
python3 max31855_gc_2.py
結果
熱電対2つ同時のグラフ描写と、CSVファイル出力ができました

コメント