導入の経緯
- 燻製を作りたくなりました から Raspberry Pi 4 を導入する流れの続き
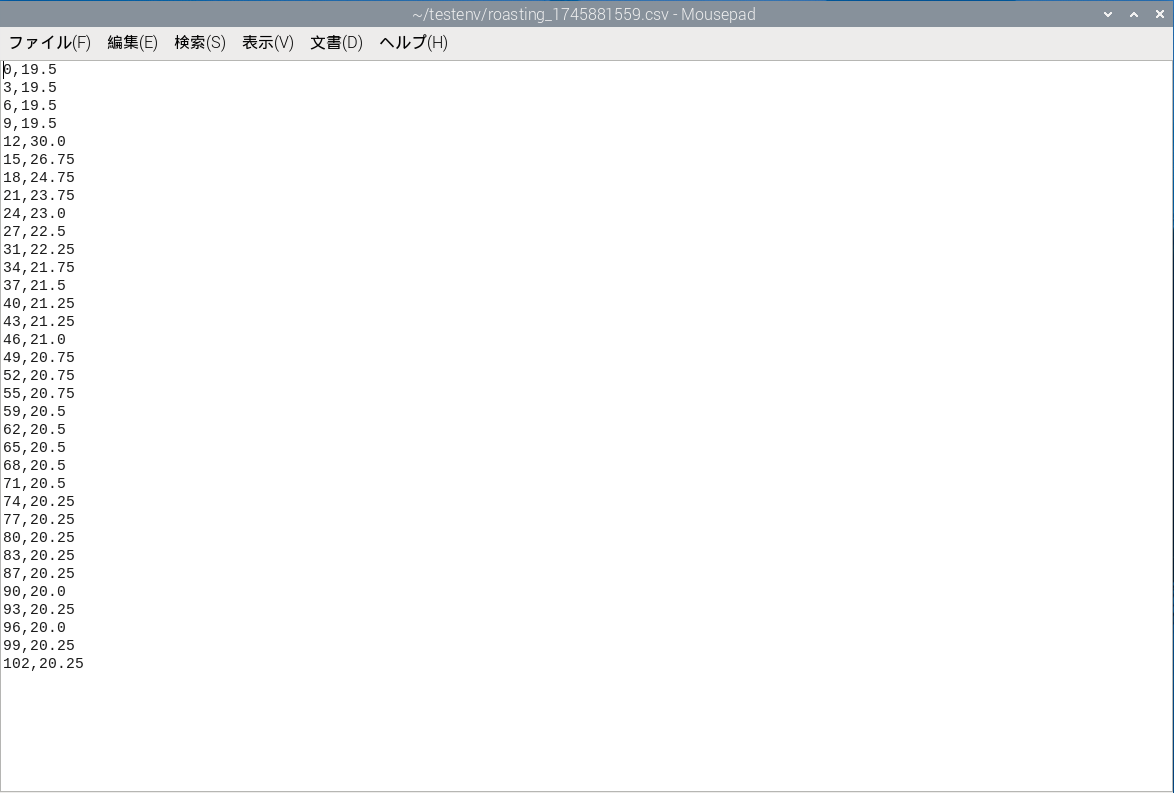
- 本稿では、Raspberry Piで熱電対で測定してグラフで表示できたので、CSVに保存するところまで記載
CSVに保存する
- スクリプトを以下の通り修正する
※前回までのスクリプトが実行できている前提です
ファイル名を、
testenvフォルダ内の、max31855_test_gc.pyとした- グラフについて
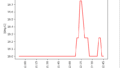
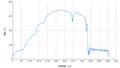
- 単純に、測定結果をリアルタイムに表示します
inv_t:約3秒間隔で取得/プロットしますmax_plot_number:最大プロット数は、3時間分としました
- CSVについて
- 作成した時間をファイル名としています
- 測定6時間ごとにファイルに書き出します
- Ctrl+Cで終了した場合、その時点まででファイルに書き出します
- Ctrl+Cで終了します
- グラフについて
# SPDX-FileCopyrightText: 2021 ladyada for Adafruit Industries
# SPDX-License-Identifier: MIT

import time
import board
import digitalio
import adafruit_max31855

import datetime
import matplotlib.pyplot as plt
import matplotlib.dates as mdates

import csv

spi = board.SPI()
cs = digitalio.DigitalInOut(board.D5)

max31855 = adafruit_max31855.MAX31855(spi, cs)

#graph
x = []#date time
y = []#tempC
ax = plt.subplot()#plot

inv_t = 3#3sec interval
max_plot_number = int(60*60*3/inv_t)#max plot 3hr

#csv
start = time.time()
data = []
num_csv = int(60*60*6/inv_t)#6hr unit


def exp_csv():

    filename = f"roasting_{int(time.time())}.csv"

    with open(filename, mode="w", encoding="utf-8") as file:
        writer = csv.writer(file)
        writer.writerows(data)


try:
    while True:

        tempC = max31855.temperature

        now = time.time()
        data.append([ int (now - start), tempC])

        x.append(datetime.datetime.now())# x add now date time
        y.append(tempC)#add temp

        ax.set_ylabel("[deg C]")# label
        plt.setp(ax.get_xticklabels(),rotation=90)#label rot 90deg
        plt.subplots_adjust(bottom=0.2)#shift plot area
        ax.xaxis.set_major_formatter(mdates.DateFormatter('%H:%M:%S'))#x label format

        ax.plot(x[-max_plot_number:],y[-max_plot_number:],'-',color = "red",label=  "temperature")#add

        ax.legend(bbox_to_anchor = (0.5,1.15))#hanrei

        print("Temperature: {} C ".format(tempC))

        if len(data) > num_csv :
                exp_csv()
                data.clear()

        plt.pause(inv_t)#wait 3sec
        ax.clear()#init
#        time.sleep(2.0)

except KeyboardInterrupt:# key - e
#    pass

    exp_csv()
- 実行について
LXTerminal で以下を実行する
- 仮想環境構築
cd testenv python -m venv .env --system-site-packages source .env/bin/activate - 実行
python3 max31855_gc.py - 結果
CSVファイルに出力できました
コメント